Viewing Class Diagrams
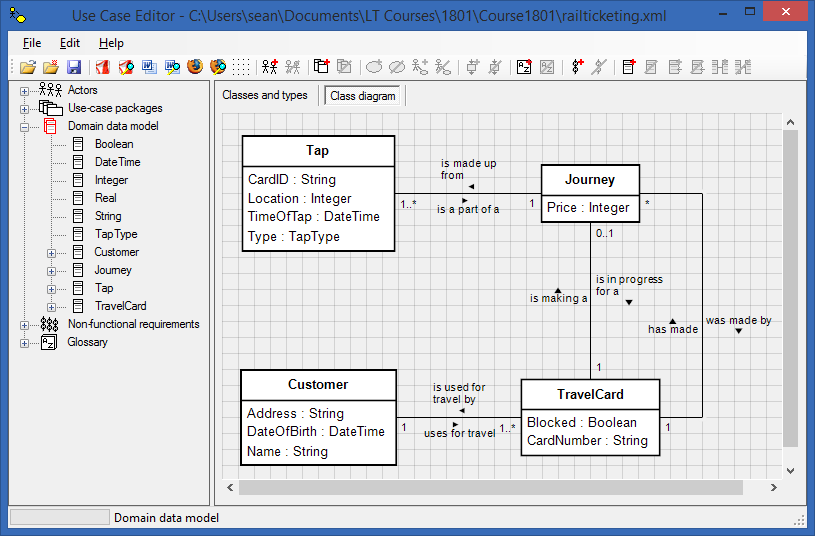
The Use Case Editor autogenerates a data model diagram as a UML class diagram from the types, entities and associations you provide when constructing your domain data model. This diagram can be viewed by selecting the ‘Domain data model’ node in the treeview, then selecting the ‘Class diagram’ tab in the right hand panel. An example of a class diagram is shown below:
Manipulating class diagrams
Although the content of the diagrams can only be set by editing the data model descriptions, the layout can be adjusted from within the diagram pane.
If you click on a class or a type in the diagram, the corresponding item changes colour to red to indicate it has been selected. The item can now be dragged to a different location on the screen. Any connectors that link to the dragged item will be adjusted so that they remain connected to the dragged item.
If you double-click a class or an association, the Use Case Editor will jump to the editing page for the corresponding class or association.
It is possible to reroute the connectors between items. If you click on a connection, the connection line will become red to indicate it has been selected. You may now right click on the connector and a pop-up menu will appear:

Note that if the right mouse button is clicked on a corner selection grip (the red rectangle at the bend in the connector), the ‘Insert bend’ menu item is replaced with ‘Remove bend’. Select all will highlight the whole diagram in red, allowing you to drag everything on the page. Insert bend will allow you to introduce new bends to the connector so that it can be routed around obstacles on the diagram. Auto Layout lets the Use Case Editor automatically layout the diagram using an internal default algorithm. Note if you select this, any manual layouts you made will be lost. There is no ‘undo’ for this layout window! As a rule, it is best to use auto layout until you are convinced your model is stable. Then as a last finessing step, adjust the layout of the class diagrams before publication of output documents. The layout algorithm for class diagrams is particularly difficult to automate, so you are encouraged to tidy up the diagram layout once your data model is pretty final.
Note too that once a connector has been highlighted, the line itself may be dragged, or by dragging the rectangular grips you can relocate the ends of each line segment. Experiment with dragging connectors, and with inserting or removing bends to familiarise yourself with the layout tools.
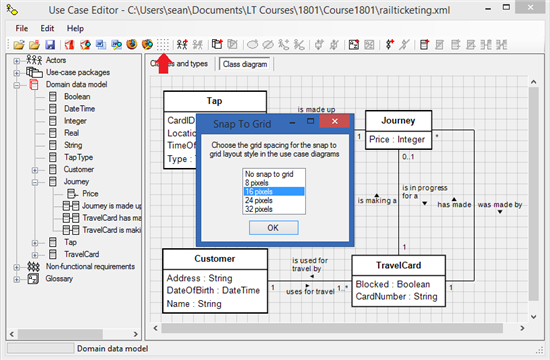
Snap to grid
By default the layout tool snaps graphical elements to a grid that has 16 pixel resolution. This makes it easy to keep lines horizontal and vertical, as well as helps to align actors and use case symbols. The grid resolution can be changed to 8, 16, 24, or 32 pixel resolution as well as being switched off altogether. To change the grid resolution select Edit | Grid spacing … from the main menu, or click the corresponding toolbar button as shown in the screenshot below: